Data
Electricity prices in Europe: what households pay per kWh in every EU country
What a kWh of electricity costs households in all 27 EU countries according to Eurostat, where it is dearest in euro and by purchasing power, how much of the price is tax and how prices moved since the energy crisis.
Published October 28, 2026
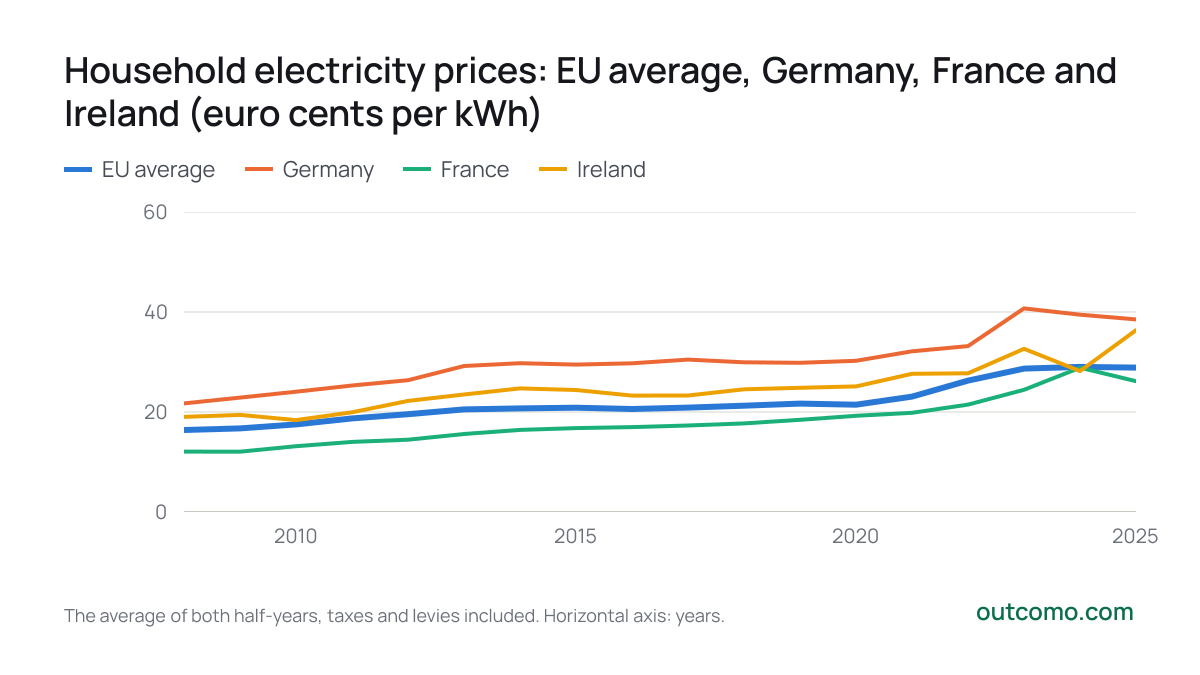
In the first half of 2026, households in the EU paid on average €0.28 per kWh of electricity, taxes and levies included. The most expensive was Ireland (€0.39), followed by Germany (€0.36); the cheapest was Hungary (€0.11), 3.4 times less.
Adjusted for price levels, that is, for what everything else costs in each country, the ranking changes. Measured in purchasing power, electricity costs the most in Romania, Poland and Czechia, and the least in Malta.
| Country | Price (€/kWh) | By purchasing power (PPS/kWh) | Taxes and levies |
|---|---|---|---|
| Ireland | 0.3871 | 0.3281 | 9% |
| Germany | 0.3618 | 0.3243 | 34% |
| Belgium | 0.3575 | 0.3160 | 22% |
| Austria | 0.3260 | 0.2861 | 24% |
| Italy | 0.3142 | 0.3277 | 25% |
| Sweden | 0.3062 | 0.2460 | 31% |
| Poland | 0.2999 | 0.4112 | 47% |
| Czechia | 0.2884 | 0.3434 | 19% |
| Romania | 0.2836 | 0.4689 | 24% |
| Finland | 0.2694 | 0.2274 | 29% |
| Cyprus | 0.2688 | 0.2988 | 27% |
| Spain | 0.2509 | 0.2797 | 29% |
| France | 0.2485 | 0.2334 | 31% |
| Netherlands | 0.2440 | 0.2080 | -10% |
| Latvia | 0.2415 | 0.3046 | 18% |
| Greece | 0.2401 | 0.2900 | 18% |
| Denmark | 0.2375 | 0.1844 | 20% |
| Portugal | 0.2367 | 0.2820 | 33% |
| Lithuania | 0.2162 | 0.2681 | 17% |
| Estonia | 0.2118 | 0.2306 | 29% |
| Slovenia | 0.2118 | 0.2414 | 23% |
| Luxembourg | 0.2023 | 0.1547 | 7% |
| Slovakia | 0.1985 | 0.2466 | 30% |
| Croatia | 0.1816 | 0.2455 | 19% |
| Bulgaria | 0.1341 | 0.2104 | 17% |
| Malta | 0.1268 | 0.1375 | 6% |
| Hungary | 0.1139 | 0.1470 | 21% |
- EU average
- Germany
- France
- Ireland
2025
- EU average28.9
- Germany38.5
- France26.2
- Ireland36.4
The average of both half-years, taxes and levies included. Horizontal axis: years.
How prices moved
The EU average is down 1.6% on the first half of 2025, when it was €0.29. Against the first half of 2021, before the energy crisis, when it was €0.22, it is up 29%. In 25 of the 27 countries a kWh costs more in euro than it did then.
Why prices differ so much between countries
- Taxes and levies. They make up 28% of the price on average across the EU, but the share varies widely: some countries tax electricity heavily, others give households part of the tax back.
- The network. Grid charges depend on how large and how old a country's networks are and how much it invests in them.
- Regulation. Where the state caps or subsidises the household price, electricity is cheaper than the market would make it; the difference is paid some other way, for example from the budget.
- The energy mix. What a country generates its power from, and how much it imports, also shows in the price of the energy itself.
How much of this price your own solar panels could save, you can work out with the solar payback calculator.
Work it out for yourself
Solar Panel Payback Calculator
Related articles
- Data
Do solar panels pay off? Payback in the US and Europe
How many years rooftop solar takes to pay back in the US and 8 European countries, how much of the power you use yourself and what shortens the wait.
- Data
How much electricity does a heat pump use? By month and by year
How many kWh of electricity a heat pump uses in a family house month by month, what it costs, why winter takes the most, how house size matters and how much less it uses with underfloor heating.
- Comparison
Electric or gas car at 12,000 miles a year?
What running an electric and a gas car costs a month at today’s prices, how long the electric car’s higher price takes to pay back and how charging at home and mileage change it.
Data sources
The article is for information only and is not financial, tax or legal advice. The numbers come straight from the sources above and change when they are updated.