Comparison
A 0.2% or a 1.5% fund fee: what the difference costs over 30 years
How much a yearly fund fee takes from regular investing: the numbers for fees from 0 to 2%, a front-end load, a lump sum and where to find what a fund costs.
Published October 7, 2026
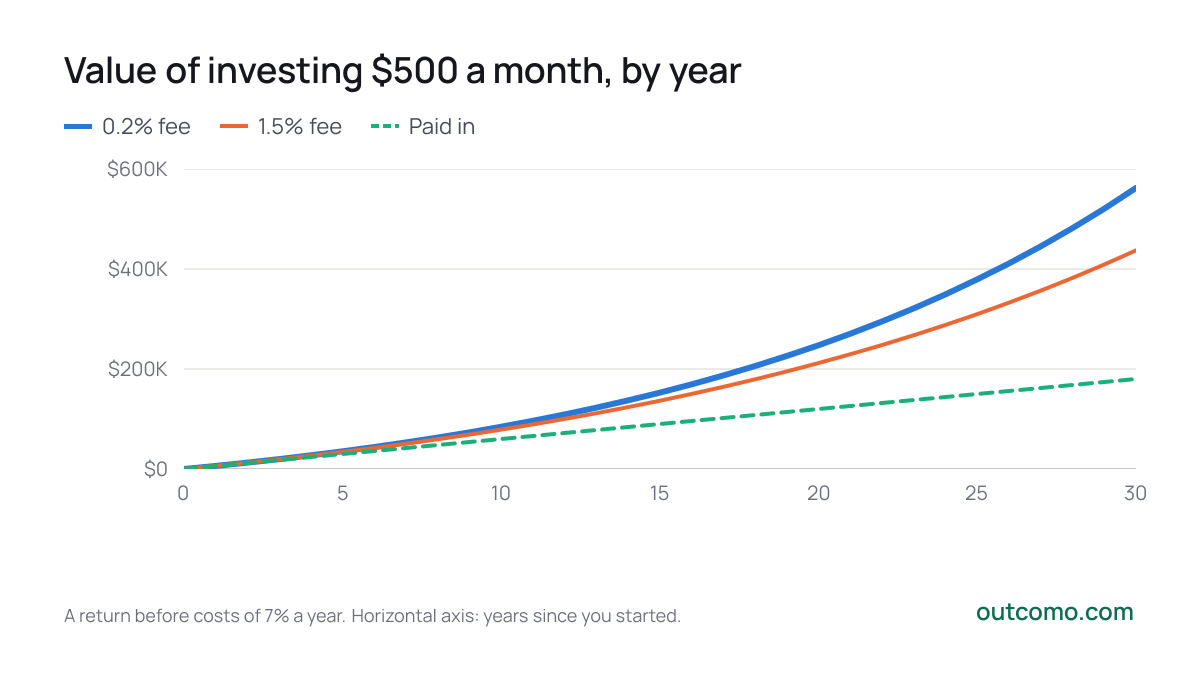
The gap between a yearly fee of 0.2% and one of 1.5% looks tiny. But invest $500 a month for 30 years and the fund charging 0.2% ends at $562,167, while the one charging 1.5% ends at $437,211. That is $124,956, or 22% less money.
Why a small percentage makes a big difference
A fund's fee is charged on the whole value of your investment, not just on the gain. With a return of 7%, a fee of 1.5% takes more than a fifth of what the investment earns in a year. And whatever the fund takes stops growing for you. Over 30 years a 0.2% fee takes 6% of the gain; a 1.5% fee takes 36%.
| Yearly fee | Return after fee | Value at the end | Less than with no fee | Share of the gain |
|---|---|---|---|---|
| 0% | 7.00% | $584,726 | – | – |
| 0.2% | 6.79% | $562,167 | −$22,560 | 6% |
| 0.5% | 6.47% | $530,120 | −$54,606 | 13% |
| 1% | 5.93% | $481,147 | −$103,579 | 26% |
| 1.5% | 5.39% | $437,211 | −$147,516 | 36% |
| 2% | 4.86% | $397,776 | −$186,951 | 46% |
The gap widens with time
In the first years the difference is small, because there is not much money in the investment yet. As the value grows, so does the amount the fund takes every year.
- 0.2% fee
- 1.5% fee
- Paid in
30
- 0.2% fee$562,167
- 1.5% fee$437,211
- Paid in$180,000
A return before costs of 7% a year. Horizontal axis: years since you started.
| Years | 0.2% fee | 1.5% fee | Difference |
|---|---|---|---|
| 10 | $84,588 | $78,756 | $5,831 |
| 20 | $247,686 | $211,950 | $35,736 |
| 30 | $562,167 | $437,211 | $124,956 |
A lump sum fares no better. $10,000 left for 30 years grows to $71,685 at a 0.2% fee and to $48,373 at 1.5%, $23,313 less.
Sales loads
Some mutual funds also charge a sales charge (a load) on every purchase, for example 3%. For the fund charging 1.5% a year, that would cut the result from $437,211 to $424,094, another $13,116. A load hurts, but over a long time it usually costs less than a higher yearly fee, because it is paid only once on each contribution.
Where to find the fees
Every mutual fund and ETF states its costs in the fee table of its prospectus: the total annual fund operating expenses (the expense ratio) and any sales charges. FINRA's Fund Analyzer, linked from the SEC's Investor.gov, lets you compare what funds cost over time. Add what you pay for the account itself: advisory, account and trading fees. In a 401(k), the plan's fee disclosure lists the funds' expense ratios.
What follows
- Compare total costs. A pricier fund pays off only if it earns more, over the long run, by more than it costs. Past returns do not promise that.
- What you pay every year matters most. The yearly fee comes off the whole value for as long as you are invested.
- Time widens the gap. The longer you invest, the more costs matter.
See also: The rule of 72 · Start investing at 25 or 35 · How much do you need to retire early?
In the fund fee calculator you compare two actual funds with your own amount, period, yearly fee and entry fee, and see how much more the expensive one would have to earn to be worth it.
Work it out for yourself
Fund fee calculator
Related articles
- Data
Stocks, bonds and cash since 1928: what earned the most
What $100 in stocks, bonds and cash since 1928 would be today, what was left after inflation, how long losses lasted and what it means for investors.
- Data
How many years to financial independence by savings rate
How many years until you can live off investments if you save 10, 20, 30 or 50% of your income, why the share matters more than the salary, and what changes it.
- Comparison
Lump sum or dollar-cost averaging? What S&P 500 history says
Should you invest a windfall at once or spread it over a few months? Every start since 1993 compared: how often the lump sum came out ahead, by how much, and when spreading it out helped.
Data sources
The article is for information only and is not financial, tax or legal advice. The numbers come straight from the sources above and change when they are updated.