Data
What $1,000 from 2000 is worth today: US inflation and other countries
How many dollars it takes today to buy what $1,000 bought in 2000, how much buying power cash lost, what $1,000 from other years is worth now and how US prices rose against other countries.
Published October 12, 2026
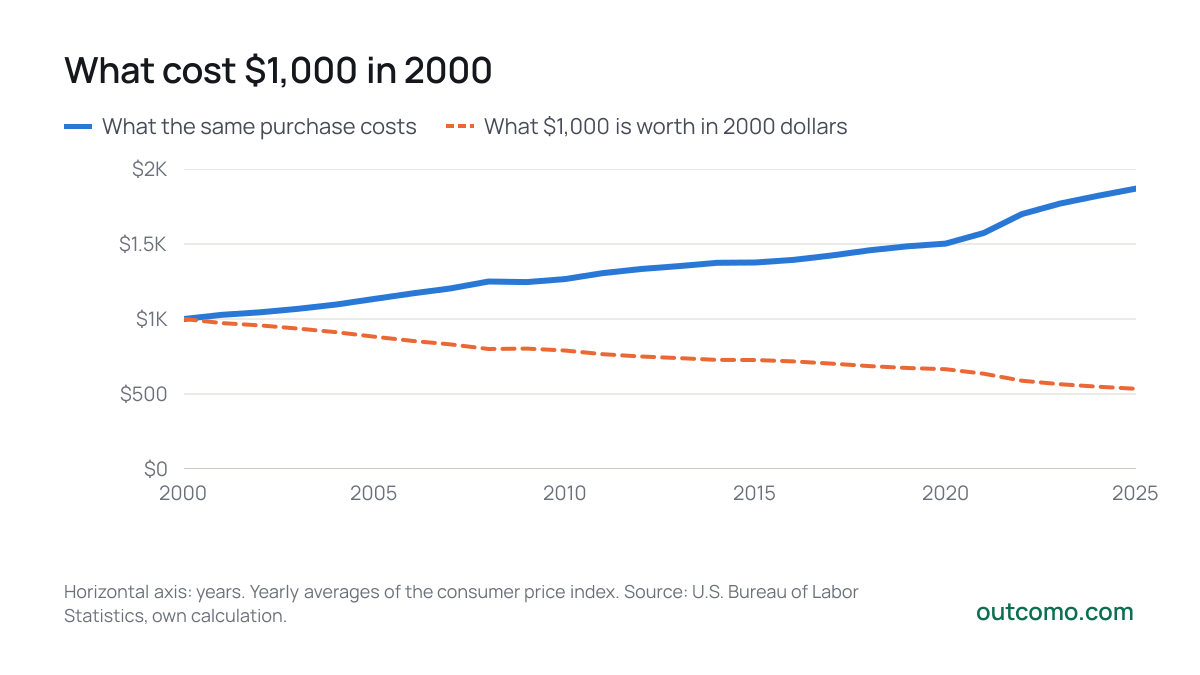
What cost $1,000 in 2000 cost $1,870 on average in 2025. Prices rose by 87% over that time, 1.9 times, or 2.5% a year on average. A thousand dollars kept in a drawer the whole time now buys only what $535 bought in 2000. It lost 47% of its buying power.
How prices rose year by year
The upper line shows how many dollars it took each year to buy what cost $1,000 in 2000. The lower one shows what the same thousand dollars, never spent, was worth in 2000 dollars.
- What the same purchase costs
- What $1,000 is worth in 2000 dollars
2025
- What the same purchase costs$1,870
- What $1,000 is worth in 2000 dollars$535
Horizontal axis: years. Yearly averages of the consumer price index. Source: U.S. Bureau of Labor Statistics, own calculation.
Prices rose fastest in 2022, by 8.0% in a single year. Since 2020 they have risen by 24% in total.
What $1,000 from other years is worth today
The further back, the more of today’s dollars one dollar of the time stands for. A thousand dollars from 1990 is worth $2,464 today.
| Year | $1,000 today | Rise in prices | Yearly average |
|---|---|---|---|
| 1990 | $2,464 | +146% | 2.6% |
| 1995 | $2,113 | +111% | 2.5% |
| 2000 | $1,870 | +87% | 2.5% |
| 2005 | $1,649 | +65% | 2.5% |
| 2010 | $1,476 | +48% | 2.6% |
| 2015 | $1,358 | +36% | 3.1% |
| 2020 | $1,244 | +24% | 4.5% |
Inflation compounds like interest. How quickly a given rate doubles prices you can work out in your head with the rule of 72.
The US and other countries
Among the 16 countries the calculator has data for since 2000, the United States comes in at number 8, with prices up 87%. Romania tops the list (471%), Switzerland is last (15%).
| Country | Rise in prices | Yearly average | Buying power left |
|---|---|---|---|
| Romania | +471% | 7.2% | 17% |
| Hungary | +232% | 4.9% | 30% |
| Mexico | +202% | 4.5% | 33% |
| Poland | +124% | 3.3% | 45% |
| Czechia | +114% | 3.1% | 47% |
| Australia | +99% | 2.8% | 50% |
| United Kingdom | +88% | 2.6% | 53% |
| United States | +87% | 2.5% | 53% |
| Austria | +86% | 2.5% | 54% |
| Belgium | +79% | 2.4% | 56% |
| Spain | +78% | 2.3% | 56% |
| Canada | +72% | 2.2% | 58% |
| Ireland | +66% | 2.0% | 60% |
| Germany | +61% | 1.9% | 62% |
| France | +51% | 1.7% | 66% |
| Switzerland | +15% | 0.6% | 87% |
Each country is measured in its own currency and with its own inflation. The table says nothing about where life is more expensive, only how fast prices rose there.
What it means
- Cash loses quietly. Money that earned no interest lost 47% of its buying power since 2000.
- Savings have to beat inflation. To keep their value since 2000, savings had to earn at least 2.5% a year on average, after taxes and fees.
- The average isn’t your basket. If more of your money goes on rent or energy, prices may have felt like they rose faster than the index says.
Work out any amount and any years in the inflation calculator. It also shows how savings with interest would have done and how prices rose in other countries.
Work it out for yourself
Inflation calculator
Related articles
- Data
Stocks, bonds and cash since 1928: what earned the most
What $100 in stocks, bonds and cash since 1928 would be today, what was left after inflation, how long losses lasted and what it means for investors.
- Data
How many years to financial independence by savings rate
How many years until you can live off investments if you save 10, 20, 30 or 50% of your income, why the share matters more than the salary, and what changes it.
- Comparison
A 0.2% or a 1.5% fund fee: what the difference costs over 30 years
How much a yearly fund fee takes from regular investing: the numbers for fees from 0 to 2%, a front-end load, a lump sum and where to find what a fund costs.
Data sources
- OECD, Consumer price indices (COICOP 2018), national CPI, all items
- OECD, Consumer price indices (COICOP 1999), national CPI, all items
- Eurostat, HICP – Romania, yearly average (prc_hicp_aind)
- State Statistics Service of Ukraine, CPI year on year (via National Bank of Ukraine)
- U.S. Bureau of Labor Statistics, CPI-U (FRED CPIAUCNS)
The article is for information only and is not financial, tax or legal advice. The numbers come straight from the sources above and change when they are updated.