Data
Buying bitcoin every month since 2014: what it would be worth today
What a fixed monthly purchase of bitcoin since 2014 would be worth today, how deep it fell along the way, how much the start year matters and how it did against the S&P 500.
Published October 7, 2026
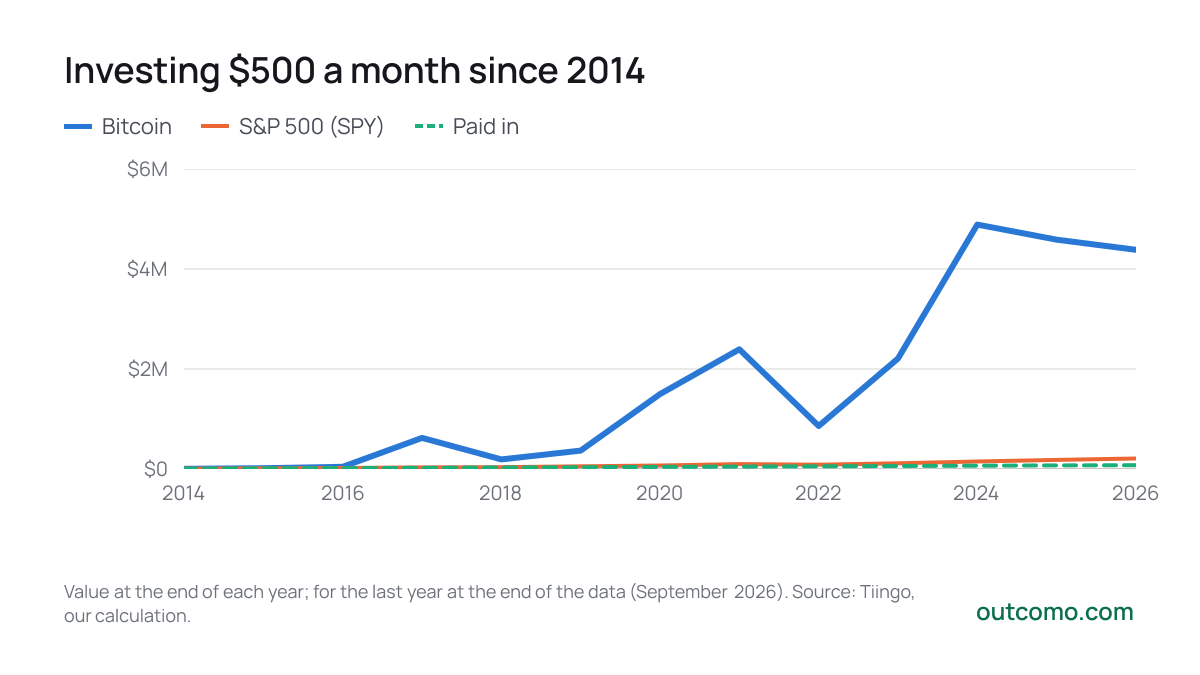
Someone who bought $500 of bitcoin every month since 2014 would have put in $76,500 by the end of the data. It would be worth $4,384,198, about 57 times the money paid in. The same purchases of the S&P 500 would have grown to $210,620, or 2.8 times.
The bitcoin figure is staggering, but the road there went through falls of more than two thirds. We look at both.
How the investment grew
- Bitcoin
- S&P 500 (SPY)
- Paid in
2026
- Bitcoin$4,384,198
- S&P 500 (SPY)$210,620
- Paid in$76,500
Value at the end of each year; for the last year at the end of the data (September 2026). Source: Tiingo, our calculation.
The road went through deep falls
On month-end prices, bitcoin has fallen by half or more 3 times since 2014. The deepest fall was 73%, from the peak of October 2021 to the bottom of December 2022. Within the months the drops were deeper still; month-end prices do not show them.
| Peak | Bottom | Fall | New high |
|---|---|---|---|
| January 2014 | April 2015 | −72% | December 2016 |
| December 2017 | January 2019 | −73% | October 2020 |
| October 2021 | December 2022 | −73% | March 2024 |
Buying every month did not smooth the falls away. At the worst moment (January 2015) the investment was worth 47% less than the money put in. Anyone who sold then would have locked in a loss.
The start year matters
Much of the result comes from the early years, when bitcoin was cheap. Later starts ended with far smaller multiples, and 10 of the 12 starts dropped below the money paid in at least once along the way.
| Start | Paid in | Value | Change | Worst below paid in |
|---|---|---|---|---|
| 2014 | $76,500 | $4,384,198 | +5,631% | −47% |
| 2015 | $70,500 | $3,303,842 | +4,586% | −6% |
| 2016 | $64,500 | $1,417,564 | +2,098% | – |
| 2017 | $58,500 | $505,990 | +765% | – |
| 2018 | $52,500 | $269,654 | +414% | −44% |
| 2019 | $46,500 | $193,725 | +317% | −3% |
| 2020 | $40,500 | $114,489 | +183% | −19% |
| 2021 | $34,500 | $67,020 | +94% | −51% |
| 2022 | $28,500 | $55,918 | +96% | −41% |
| 2023 | $22,500 | $35,388 | +57% | −3% |
| 2024 | $16,500 | $18,085 | +10% | −23% |
| 2025 | $10,500 | $10,369 | -1% | −33% |
The weakest result belongs to the start in 2025 (-1%). The later someone started, the less time the investment had to recover from the falls.
Every month or all at once
Putting the whole $76,500 in during the first month would have grown to $7,990,579. The lump sum won because the first purchase came at one of the lowest prices in the data. Buying every month is not meant to give the highest return. It protects you from putting everything in just before a big fall, and you can pay for it out of your regular income.
What to take from it
- The past need not repeat. The result is driven mostly by the years when bitcoin was a small, cheap asset. That says little about how it will grow from here.
- You can lose a lot, or all of it. Bitcoin has no issuer or earnings behind its price, only what buyers will pay. It has already lost more than two thirds of its value more than once, and nothing guarantees it will recover the next time.
- Fees and taxes. They are left out. Exchanges charge a fee on every purchase, and gains on crypto are taxable.
- This is not a recommendation. The article shows what would have happened in the past, not what will happen.
See also: Lump sum or dollar-cost averaging?
Pick another period, amount or fee in the DCA calculator. It also compares bitcoin with S&P 500 and world stock ETFs or with gold.
Work it out for yourself
DCA Calculator
Related articles
- Comparison
Lump sum or dollar-cost averaging? What S&P 500 history says
Should you invest a windfall at once or spread it over a few months? Every start since 1993 compared: how often the lump sum came out ahead, by how much, and when spreading it out helped.
- Data
Stocks, bonds and cash since 1928: what earned the most
What $100 in stocks, bonds and cash since 1928 would be today, what was left after inflation, how long losses lasted and what it means for investors.
- Comparison
A 0.2% or a 1.5% fund fee: what the difference costs over 30 years
How much a yearly fund fee takes from regular investing: the numbers for fees from 0 to 2%, a front-end load, a lump sum and where to find what a fund costs.
Data sources
The article is for information only and is not financial, tax or legal advice. The numbers come straight from the sources above and change when they are updated.